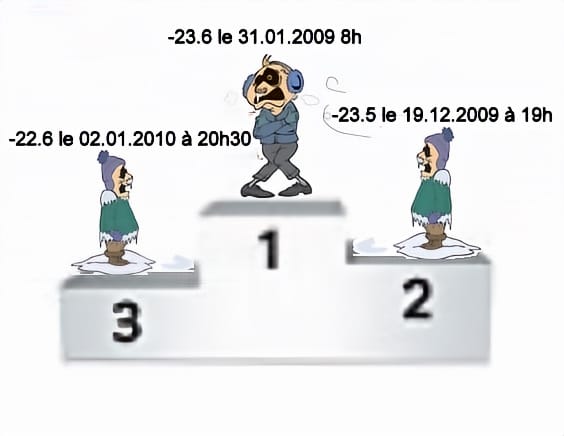
L’hiver 2010 a été froid, avec des pics répartis sur toute la période. Notons encore ces mesures : -20.9 le 11.02.2010 à 7h30, -19.4 le 09.03.2010 à 7h30, -14.7 le 01.04.2010 à 21h30.
L’hiver 2010 a été froid, avec des pics répartis sur toute la période. Notons encore ces mesures : -20.9 le 11.02.2010 à 7h30, -19.4 le 09.03.2010 à 7h30, -14.7 le 01.04.2010 à 21h30.